March 6th, 2026
Improved
Checkly Playwright Reporter 1.8.
The “Yes, we rewrote it and yes, it’s better.” Release
If you’ve been here before v1, this is the “we touched basically everything” update, condensed so you don’t have to diff eight releases.
If you’re new: perfect timing.
This release turns the Checkly reporter for Playwright into the thing it was always meant to be: production-ready, CI-flexible, security-conscious, and actually helpful when things go sideways.
It runs alongside your Playwright tests, captures execution data (logs, traces, network activity, console output, performance metrics), and uploads it to Checkly so your team can debug runs without digging through CI artifacts or downloading trace files.
You can get the Playwright Reporter here.
The Checkly Playwright Reporter doesn’t just collect Playwright test results. It also surfaces debugging data that usually lives buried inside trace files or CI artifacts:
Scrubs secrets automatically
Uploads traces, logs, videos, screenshots and snapshots
Shows console and network data extracted from the playwright trace
Visualizes CPU and memory usage
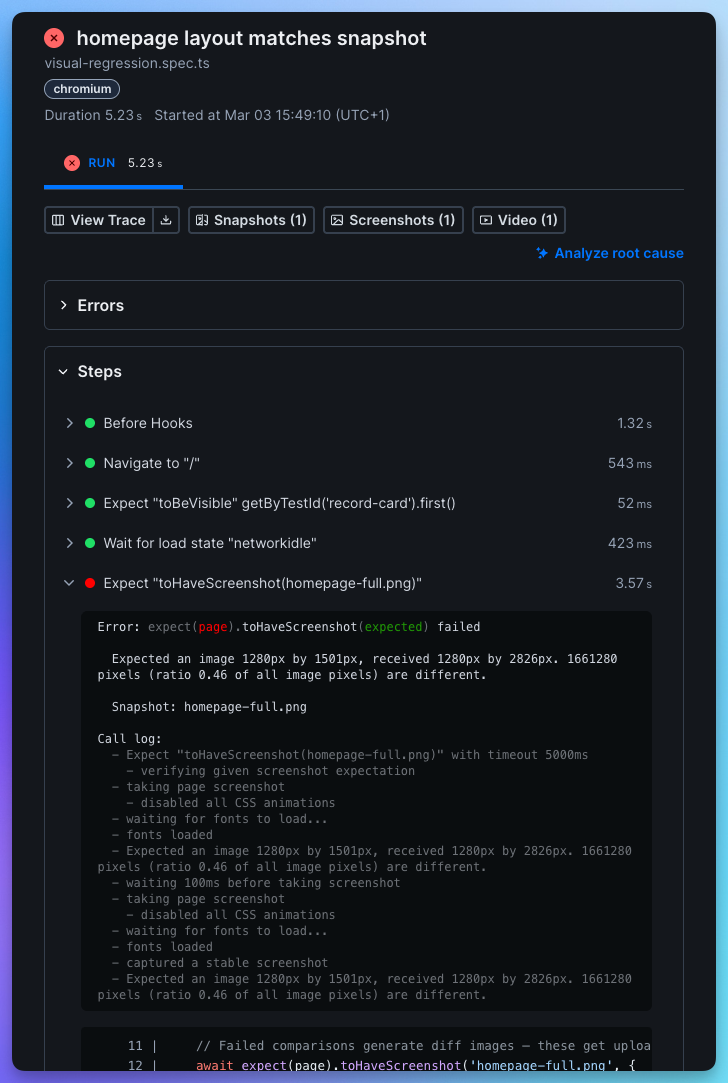
Root cause analysis by Rocky AI
Shows steps and code snippets for every test step
Makes CI runs shareable without sending someone .
zipfiles and log copy-pastes
If you want to see every config option available, check out the demo repository.
🔐 Your secrets are safe now
The reporter now automatically scrubs sensitive values from reports and trace files.
You can fully control it, specifying custom variables to be scrubbed:
createChecklyReporter({ scrubbing: { envVars: ['API_KEY', 'DB_PASSWORD'], autoDetect: true, replacement: '[REDACTED]' } }) 📊 Summary table at the end of every run
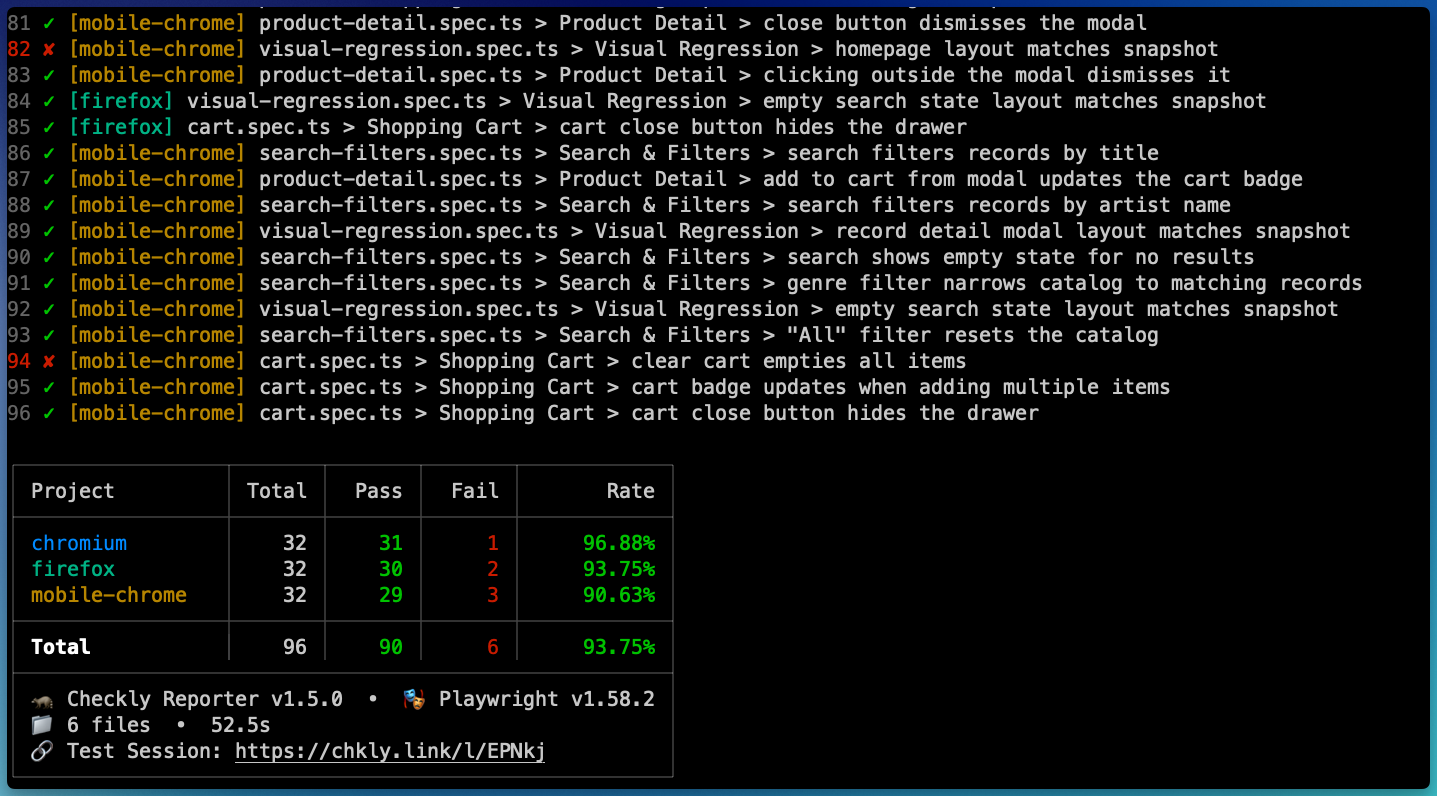
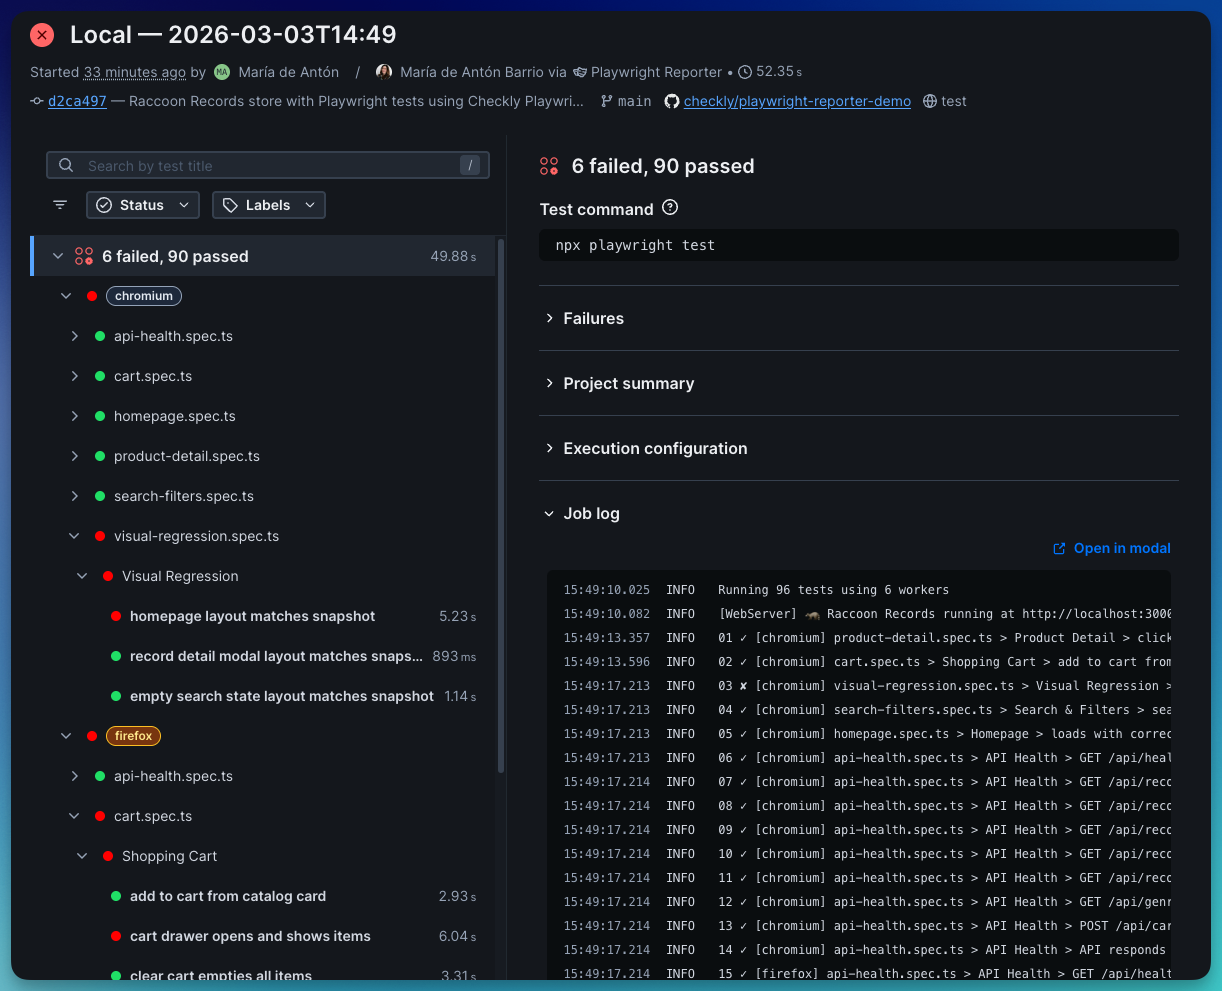
While tests are running, you get colour-coded [project] indicators in your terminal so you can quickly see what’s passing and what’s… not.
At the end of the run, you get a per-project breakdown, right in your terminal, plus deep links to traces and full results in Checkly.
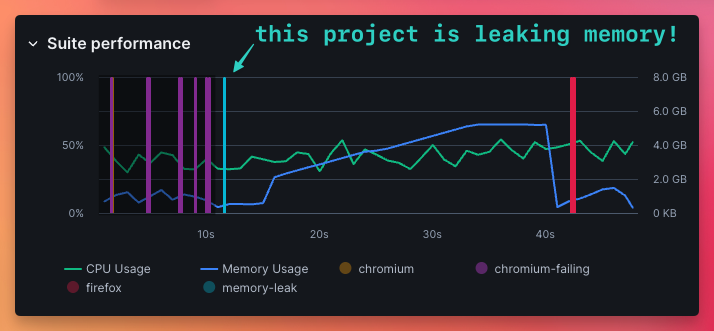
⚙️ Suite Performance Graph
Now you can see CPU and memory usage over time as your Playwright test suite runs, broken down by project. Each Playwright project is highlighted on the timeline, so you can spot which one causes CPU or memory spikes. Use the Suite Performance Graph to:
Find memory leaks
Identify resource-heavy projects,
Adjust your playwright configuration
Right-size your CI machines.
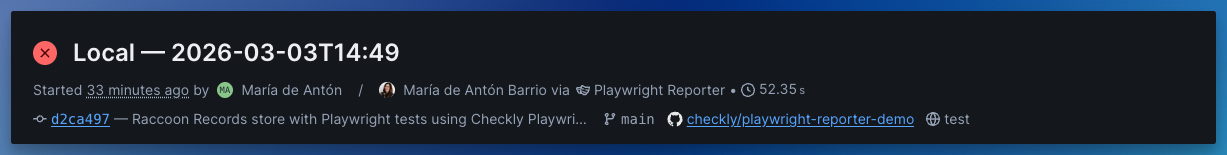
🌿 Automatic git detection
Branch, commit SHA, and author are auto-detected in CI and locally. No configuration. No manual wiring. It just works.
🧠 Test step code snippets in Checkly
Step reports now include
Root cause analysis powered by Rocky AI
The exact source line
Surrounding context
Direct Trace, Snapshots, Screenshots and Video assets.
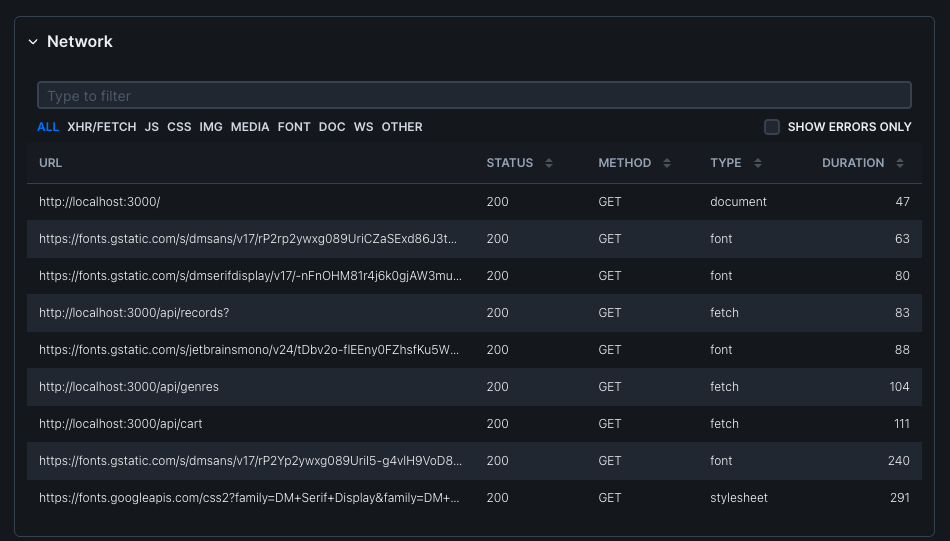
🌐 Richer network + browser console data
Network requests now include:
Domain
Resource type
Headers
Timing
Transfer + resource bytes
🧾 Test command + run logs
The test command is now automatically detected and shown in the Checkly UI. Job logs from the run are also uploaded for you to review and share with your team.
TL;DR
If you’re running Playwright tests locally and in CI, the Checkly Playwright Reporter lets you see the same debugging insights you get from Checkly monitoring, without digging through trace files or CI logs.
Getting started takes about a minute:
Install the reporter
npm install --save-dev @checkly/playwright-reporterExport your Checkly Account ID and API key
export CHECKLY_API_KEY=your_api_key
export CHECKLY_ACCOUNT_ID=your_account_id
Add the reporter to your
playwright.config.ts:import { defineConfig } from '@playwright/test'; import { createChecklyReporter } from '@checkly/playwright-reporter'; export default defineConfig({ reporter: [ ['list'], createChecklyReporter(), ], });`Run your tests
npx playwright test
Now open the run in Checkly and explore traces, logs, network requests, console output and performance data.
For updates, check out the Checkly Reporter Changelog and Checkly Reporter Docs
Happy Playwright testing (and happier debugging!)
Questions or feedback? Join our Slack community.