What’s New in May: CLI 8, Private Location metrics, Maintenance Window improvements and Playwright Check Suite upgrades
May brought many big releases: CLI 8, faster Playwright Check Suites, Private Location metrics, safer alert channels and more flexible Maintenance Windows.
Here’s the roundup: big launches, small fixes, and the updates you and your favorite AI agent should probably know about too.
Checkly CLI 8: ESM-only, cancellable runs, and recording by default
CLI 8 ships three major changes:
ESM-only: requires Node.js versions matching
^20.19.0 || >=22.12.0Cancellable Playwright Check Suite runs:
CTRL+Cnow cancelstest,pw-test, andtriggerruns instead of burning quota in the backgroundRecording by default:
test,pw-test, andtriggernow record unless you pass-no-record
Want the run to keep going? Use detached mode:
npx checkly test -d Also included: bundled jiti, Playwright include patterns resolved from the config directory, and automatic .env loading.
Learn more in the Checkly CLI 8 announcement
# Don’t forget to upgrade
npm install -D checkly@latest
Playwright Check Suites: faster private location runs, full control
We shipped a batch of improvements to make Playwright Check Suites faster, more reliable, and easier to debug.
Highlights include:
Cancellable runs for queued and in-progress Check Suite runs
Custom runtime engines with Bun
1.7and Node.js22,24, and26Automatic retries for setup steps affected by transient network or cache issues
Browser caching in Private Locations to avoid repeated Playwright browser downloads
Full Playwright
globalTimeoutsupport with timeout errors shown in logs and the Failures tabBetter trace processing logs for report generation, trace processing, and secret scrubbing
Private Location browser caching is available from Private Location agent version 8.2.0
👉🏼 Learn more in the Playwright Check Suites changelog update.
Private Location observability metrics are now in the UI, Prometheus
You can now see Private Location health and performance metrics directly in the Checkly UI, making it easier to understand how your agents are doing and whether your Private Location has enough capacity.
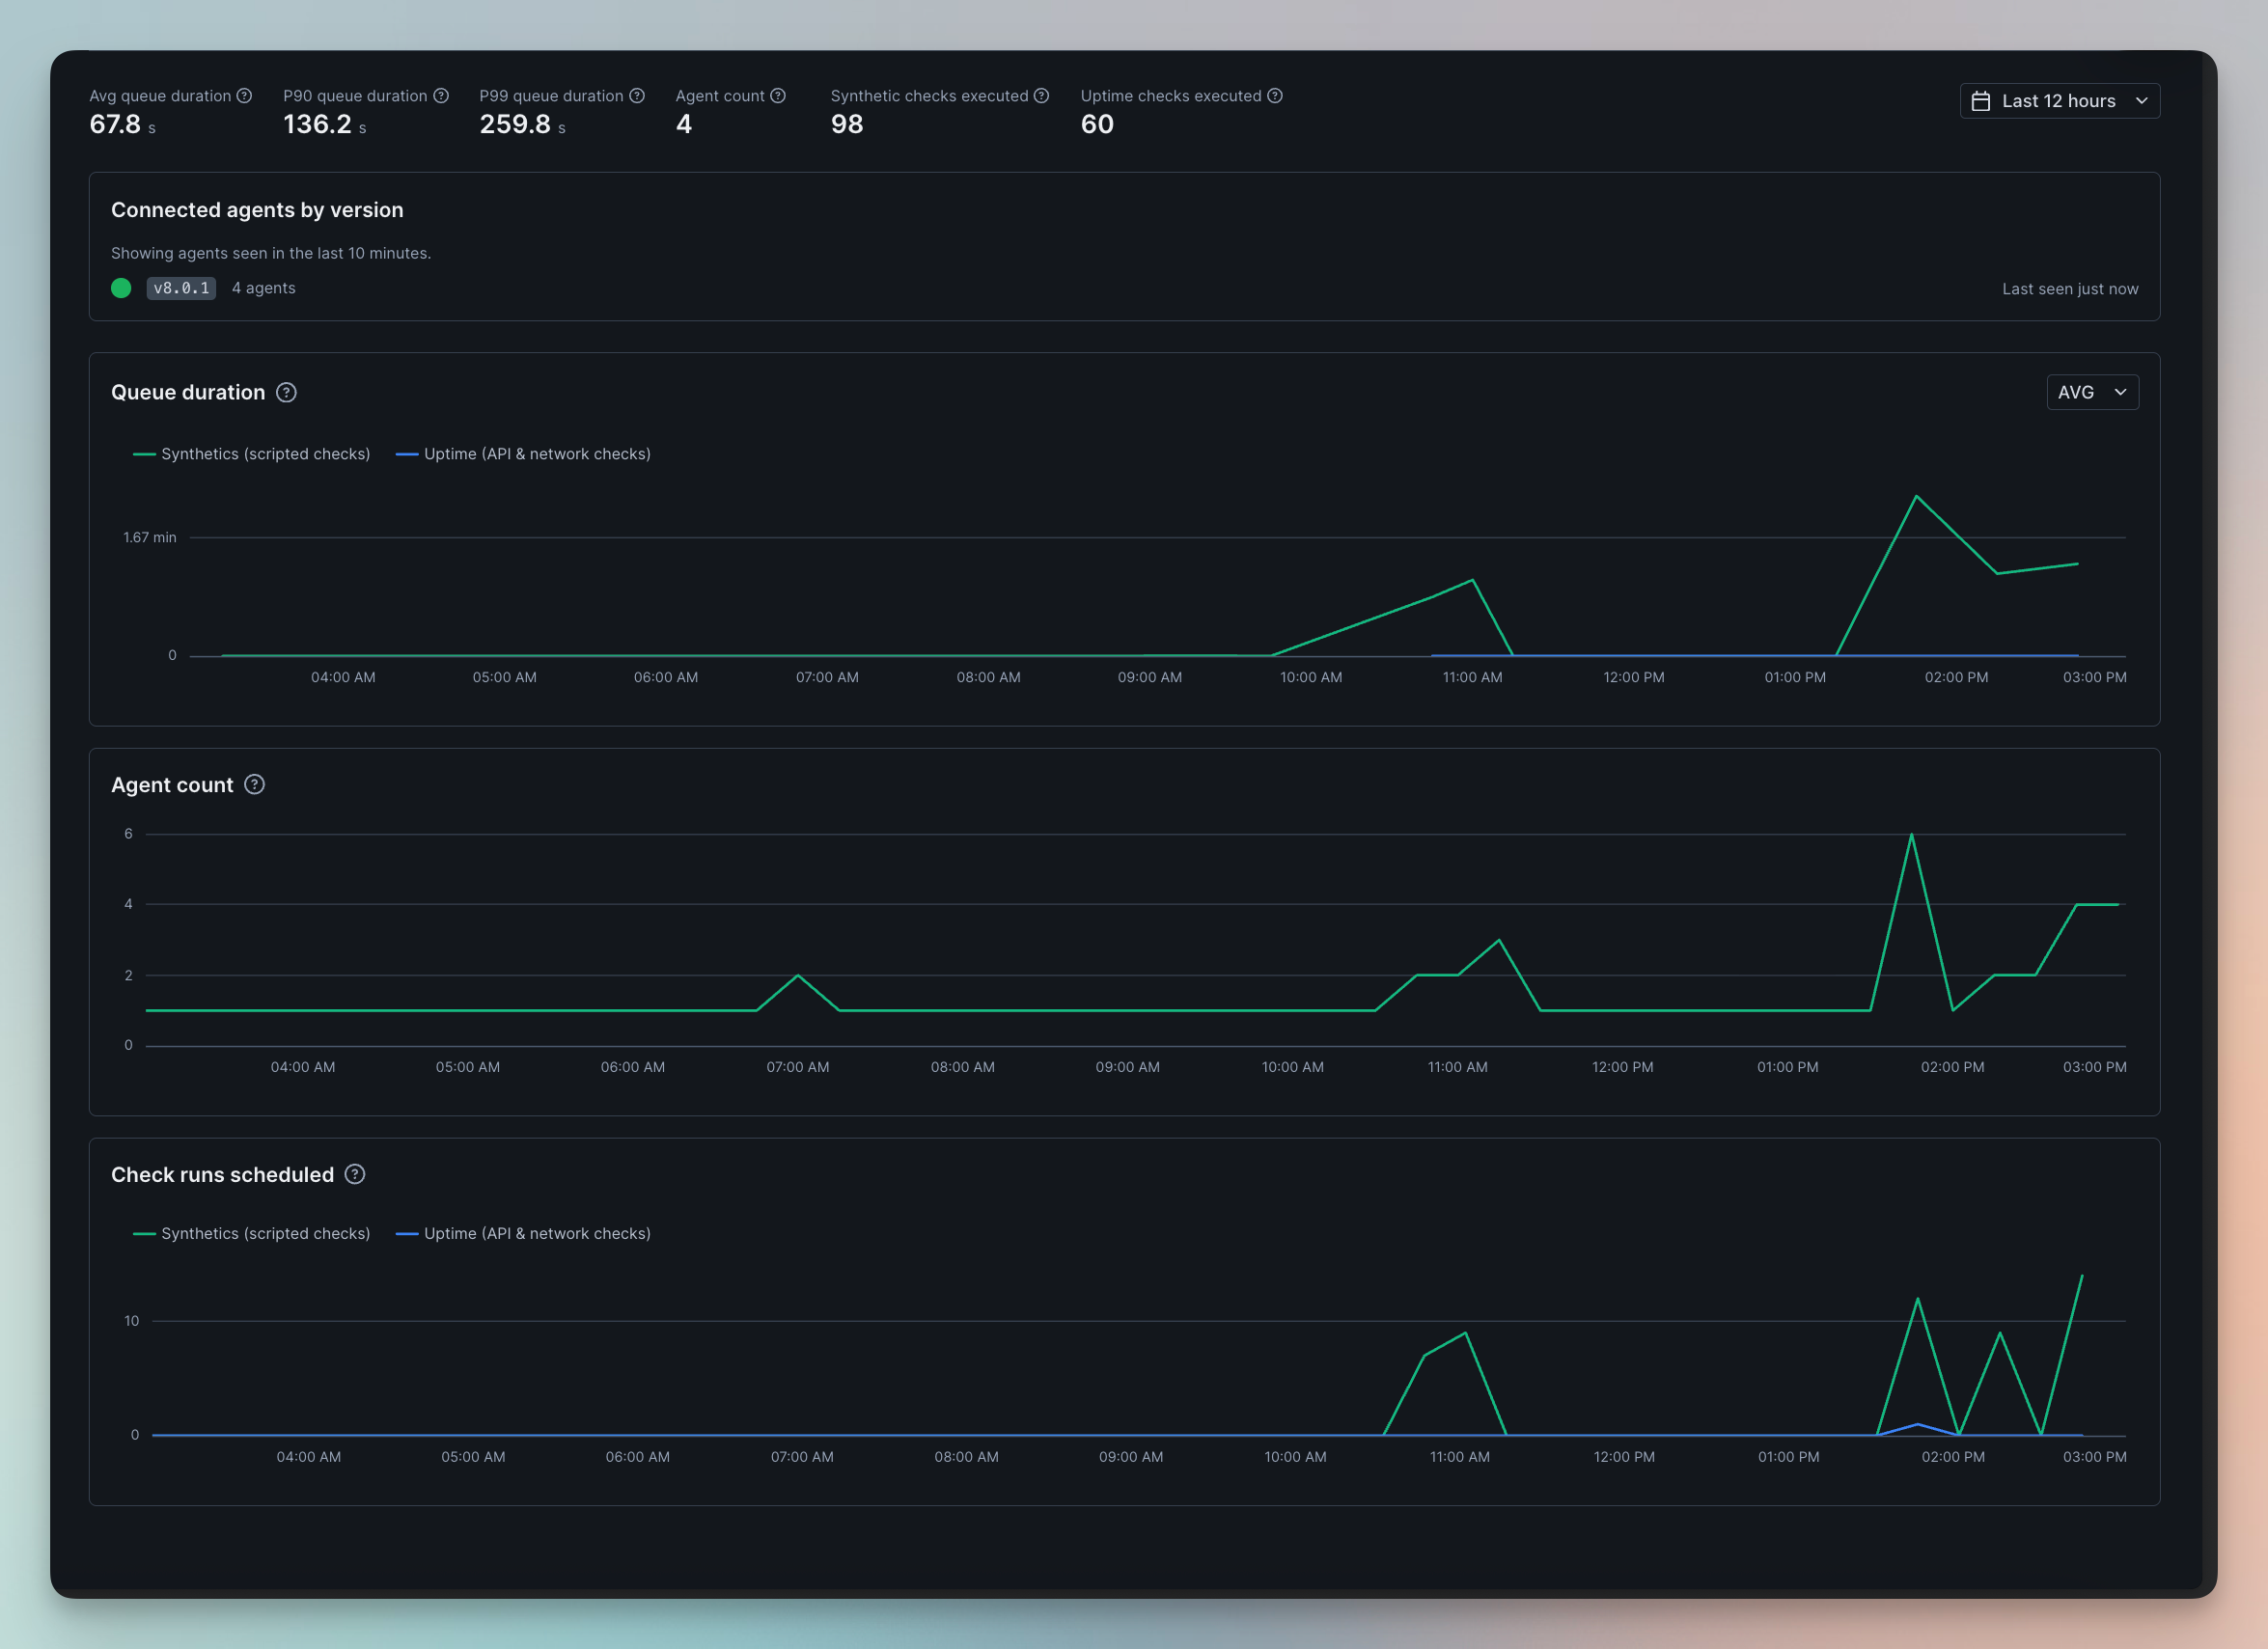
The new metrics include:
Queue duration — how long checks wait before an agent picks them up
Agent count — how many agents are currently reporting
Scheduled check runs — how many check runs are scheduled for the Private Location
These metrics help you spot whether your Private Location agents are over- or underprovisioned. For example, if checks are spending too much time in the queue before they run, that’s a strong signal that your agents may need more capacity. No more guessing whether the queue is fine, spicy, or quietly on fire.
We also updated how Private Location status is shown in the UI. The previous green-dot indicator has been replaced with a clearer Reporting / Not Reporting state, with Last seen at shown alongside it. This makes agent health checks easier to read at a glance.

For teams running Private Location agents on Kubernetes, these metrics are also available through Prometheus V2. You can use them to autoscale Private Location capacity with KEDA, based on queued and in-flight check runs
The new Private Location Autoscaling Guide shows how to use the checkly_private_location_check_runs metric to scale agent pods up during traffic bursts and back down when demand drops. That helps prevent queue buildup without keeping idle capacity around just in case.
Alert channels now support environment secrets
Alert channels now support secrets with the double {{ secret here}} syntax, so sensitive values like API keys no longer need to live in plain text inside alert channel configs.
That means fewer secrets sitting around in the UI or API responses. Always a good day when plaintext secrets pack their little bags and leave.
You can also convert existing values into secrets by clicking the new lock icon in the alert channel configuration.
Maintenance Windows: pause checks, silence alerts, or both
Maintenance windows now give more granular control over what happens to checks during planned downtime. Instead of just pausing checks, two behaviors can be independently configured: Pause check execution
Scheduled check runs are skipped for the duration of the window
Scoped to all checks or specific checks by tag
Manual and triggered runs (UI, API trigger) always execute regardless [new behavior]
Silence alerts
Checks keep running and collecting data, but alert notifications (email, Slack, etc.) are suppressed
Scoped to all checks or specific checks by tag, can use different tags than the pause scope
New reminders are suppressed, existing reminders are paused and resume after the window ends
The home dashboard now shows a maintenance badge on affected check, group, and heartbeat rows with paused/silenced state, an updated banner summarizing active behaviors, and a new "Under maintenance" status filter.On the API side, maintenance window endpoints now accept pauseAllChecks, silenceAlertsTags, and silenceAllAlerts, in addition to the pre-existing tags.Existing maintenance windows continue to work as before. CLI, TF and Pulumi support isn't included and will require a follow-up.
API PSA: swagger.json is deprecated
The old API spec at:
<https://api.checklyhq.com/swagger.json> is now deprecated and frozen.
Please use the newer OpenAPI spec instead:
<https://api.checklyhq.com/openapi.json> The old swagger.json file will remain available for compatibility, but now includes a deprecation notice in the file description and response headers. Modern spec, fewer sharp edges.
Happy monitoring!
Questions or feedback?