June 30th, 2026

Here’s a roundup of the new features and improvements we shipped over the past month.
Checkly MCP Server
We released our first version of the Checkly MCP! You can read the announcement or install it straight away using its URL:
https://api.checklyhq.com/mcp
You’ll find more specific instructions for each supported client, as well as limitations in our documentation.
Checkly CLI v8.10.0: What’s New
Upgrade to v8.10.0 to access the latest CLI features and improvements released over the past month.
Deploy larger CLI projects reliably (CLI v8.10.0)
The CLI now supports large deployments more reliably, including projects with thousands of resources. For longer deployments, the CLI displays progress based on the resources being created or updated. It also handles multiple deployments started at the same time:
By default, a new deployment waits for the current deployment to finish.
Use
-cancel-in-progress-deploymentto cancel the running deployment and start the new one immediately.
Result assets, straight from the terminal (CLI v8.8.0)
No more digging through nested check-result JSON. List and download the artifacts of any check run or test-session result - logs, Playwright traces, videos, screenshots, pcaps, reports:
checkly assets list --result-id <id> --check-id <id>(or --test-session-id) — filter by--type/--asset, view as table/tree/jsoncheckly assets download <same as above> --type all— pulls everything into ./checkly-assets/…, with--force/--skip-existing
→ Learn more in our docs.
Drill into a single test-session result (CLI v8.7.0)
Jump straight to one result's logs and timing inside a session with checkly test-sessions get <id> --result <result-id>. Pairs with checkly test-sessions list to find the session first.
→ Learn more in our docs.
Delete a check by ID (CLI v8.8.0)
Delete a check by ID with checkly checks delete <id>. Confirmation prompt by default (or --force), plus --dry-run to preview. Note that checks managed by a CLI project get recreated on the next deploy, remove those from your project code instead.
→ Learn more in our docs.
Manage account members (CLI 8.7.0)
Use checkly account members update / delete to manage account members. Beyond listing, you can now change a member's role (--role) or remove them, by email or user ID. Confirmation prompt and --dry-run included.
→ Learn more in our docs.
Tag Manager: Manage tags in one place
The Tag Manager is now available in the top level menu under Configuration, making it easier to manage tags across your entire account.
You can now:
Rename existing tags: Updates the tag everywhere it is used, including checks, groups, and maintenance windows.
Delete unused or incorrect tags: Clean up typos and outdated tags without updating each resource individually.
Add tag descriptions: Give Rocky AI additional context it can use when generating root cause analyses.
The Tag Manager is currently available in the Checkly UI only. Head to the Checkly Webapp to try it out now.
Developer Experience
Checkly Slack app
You can now install the Checkly Slack app to receive alerts and rerun checks or AI analyses directly from Slack. The app replaces webhook-based Slack alerts and is available through a new CLI construct, with Terraform support coming soon. Learn more on the in-app installation page or in the docs.
Cancel Agentic Check runs
You can now cancel Test prompt runs, Test session runs, and Check runs for Agentic Checks from both the API and UI.
Rocky AI RCA now uses OTel traces and the last passing result
To improve root cause analysis, Rocky AI now automatically looks for related OTel traces and compares the failure against the most recent passing result. This gives Rocky more context to identify regressions and explain what changed. Read the full changelog for more information.
Trace IDs are now included in check result API responses
When using Checkly OpenTelemetry Traces, the Check Run Result now returns the corresponding Trace ID through the API:GET /v1/check-results/{checkId}/{checkResultId}. You can use this ID to correlate a check run with its trace in Checkly or your observability backend.
HTTPS record support for DNS monitors
DNS monitors now support the HTTPS resource record type. Learn more in the DNS monitor docs.
Happy monitoring!
Questions or feedback? Join our Slack community.
June 25th, 2026
New
AI agents can now connect directly to Checkly through the Model Context Protocol (MCP).
The new Checkly MCP Server gives your agentic client of choice a secure, OAuth-based access to your Checkly account, so your agent can inspect live monitoring data, understand check health, investigate recent failures, and help with incident workflows without leaving your conversation.
With the Checkly MCP Server, your agent can:
List accounts and understand available Checkly features
Inspect check status, recent results, test sessions, and result assets
Read and trigger Rocky AI root cause analyses
Trigger existing deployed checks on demand
Read status pages and manage status page incidents
Manage account-level environment variables, with secret values protected
This is designed for live Checkly account operations. For creating, editing, testing, or deploying Monitoring as Code projects, keep using Checkly Skills and the Checkly CLI. The MCP server runs remotely, so it cannot access your local project files.
You can connect Codex, Claude Code, Cursor, VS Code, or any MCP client that supports Streamable HTTP and OAuth.
Learn how to connect your client in the MCP Server docs:
https://checklyhq.com/docs/ai/mcp-server
Happy monitoring!
Questions or feedback? Join our Slack community.
June 1st, 2026
Improved
We just added two new sources of data Rocky AI can pull from to create a root cause analysis for your failing checks, monitors and test results.
Open Telemetry Traces
If you are using Checkly Traces, Rocky AI now automatically finds, queries and evaluates relevant traces linked to your failures. The example below is from Checkly’s own backend infrastructure.
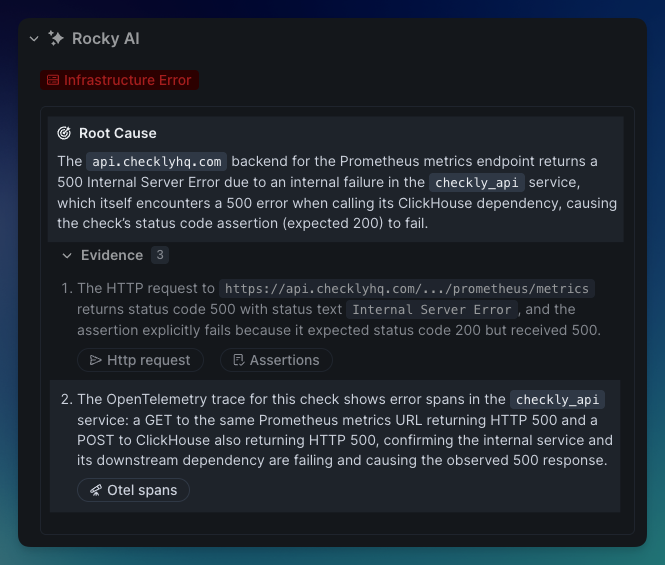
Our API check that checks if our customer facing Prometheus endpoint works, failed with a 500 error.
The OTeL trace indicates this was actually do to our Clickhouse server returning a 500 errors, immediately telling our on-call team where to start looking.
Without the trace, we would have to look at all the various logging, error tracking and other tools that are integrated into the various middleware and infrastructure this request passes through (our load balancer, REST API server, Redis datastore etc.)
This feature is now live for all Checkly Traces users. Checkly Traces and Rocky AI Root Cause Analyses are part of the Checkly Resolve package. 10 Rocky AI root cause analyses are part of the free Checkly Hobby plan.
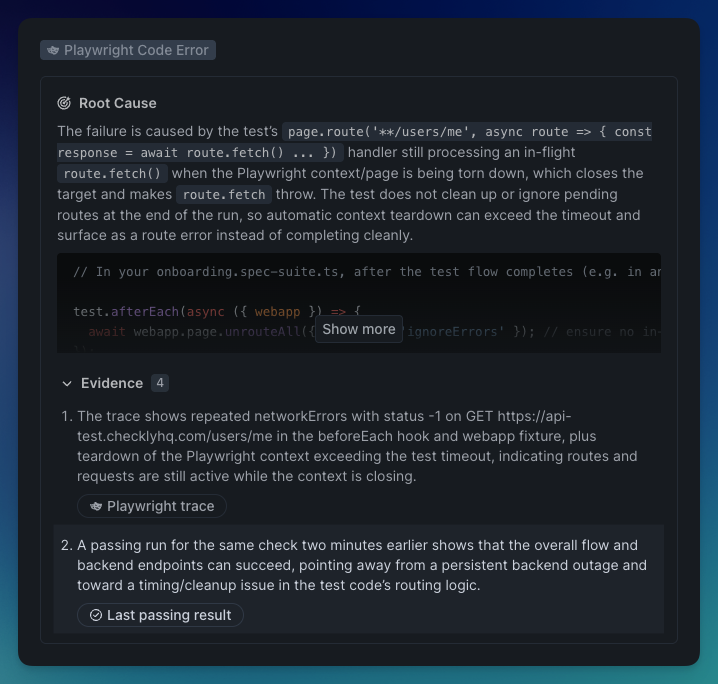
Last passing result
Rocky AI now automatically searches for and interprets a last passing result for your failing check, monitor or check result. This is useful to more clearly indicate what the nature of a regression is: specifically for more “verbose” checks like Playwright, Browser and Multistep checks.
It can indicate for instance that a network error is transient, not persistent, as it can see that an earlier call — 2 minutes earlier in the example below — passed without failure.
Two caveats:
A last passing result for monitors and checks might not always exist: the check might start failing immediately after creation.
A last passing result for test session might not exist because it is the first run, or when the test name was changed, the individual spec was removed from a test suite etc.
This feature is now live for all Rocky AI Root Cause Analyses users.
Happy monitoring!
Questions or feedback? Join our Slack community.
May 29th, 2026
Monthly update
May brought many big releases: CLI 8, faster Playwright Check Suites, Private Location metrics, safer alert channels and more flexible Maintenance Windows.
Here’s the roundup: big launches, small fixes, and the updates you and your favorite AI agent should probably know about too.
Checkly CLI 8: ESM-only, cancellable runs, and recording by default
CLI 8 ships three major changes:
ESM-only: requires Node.js versions matching
^20.19.0 || >=22.12.0Cancellable Playwright Check Suite runs:
CTRL+Cnow cancelstest,pw-test, andtriggerruns instead of burning quota in the backgroundRecording by default:
test,pw-test, andtriggernow record unless you pass-no-record
Want the run to keep going? Use detached mode:
npx checkly test -d Also included: bundled jiti, Playwright include patterns resolved from the config directory, and automatic .env loading.
Learn more in the Checkly CLI 8 announcement
# Don’t forget to upgrade
npm install -D checkly@latest
Playwright Check Suites: faster private location runs, full control
We shipped a batch of improvements to make Playwright Check Suites faster, more reliable, and easier to debug.
Highlights include:
Cancellable runs for queued and in-progress Check Suite runs
Custom runtime engines with Bun
1.7and Node.js22,24, and26Automatic retries for setup steps affected by transient network or cache issues
Browser caching in Private Locations to avoid repeated Playwright browser downloads
Full Playwright
globalTimeoutsupport with timeout errors shown in logs and the Failures tabBetter trace processing logs for report generation, trace processing, and secret scrubbing
Private Location browser caching is available from Private Location agent version 8.2.0
👉🏼 Learn more in the Playwright Check Suites changelog update.
Private Location observability metrics are now in the UI, Prometheus
You can now see Private Location health and performance metrics directly in the Checkly UI, making it easier to understand how your agents are doing and whether your Private Location has enough capacity.
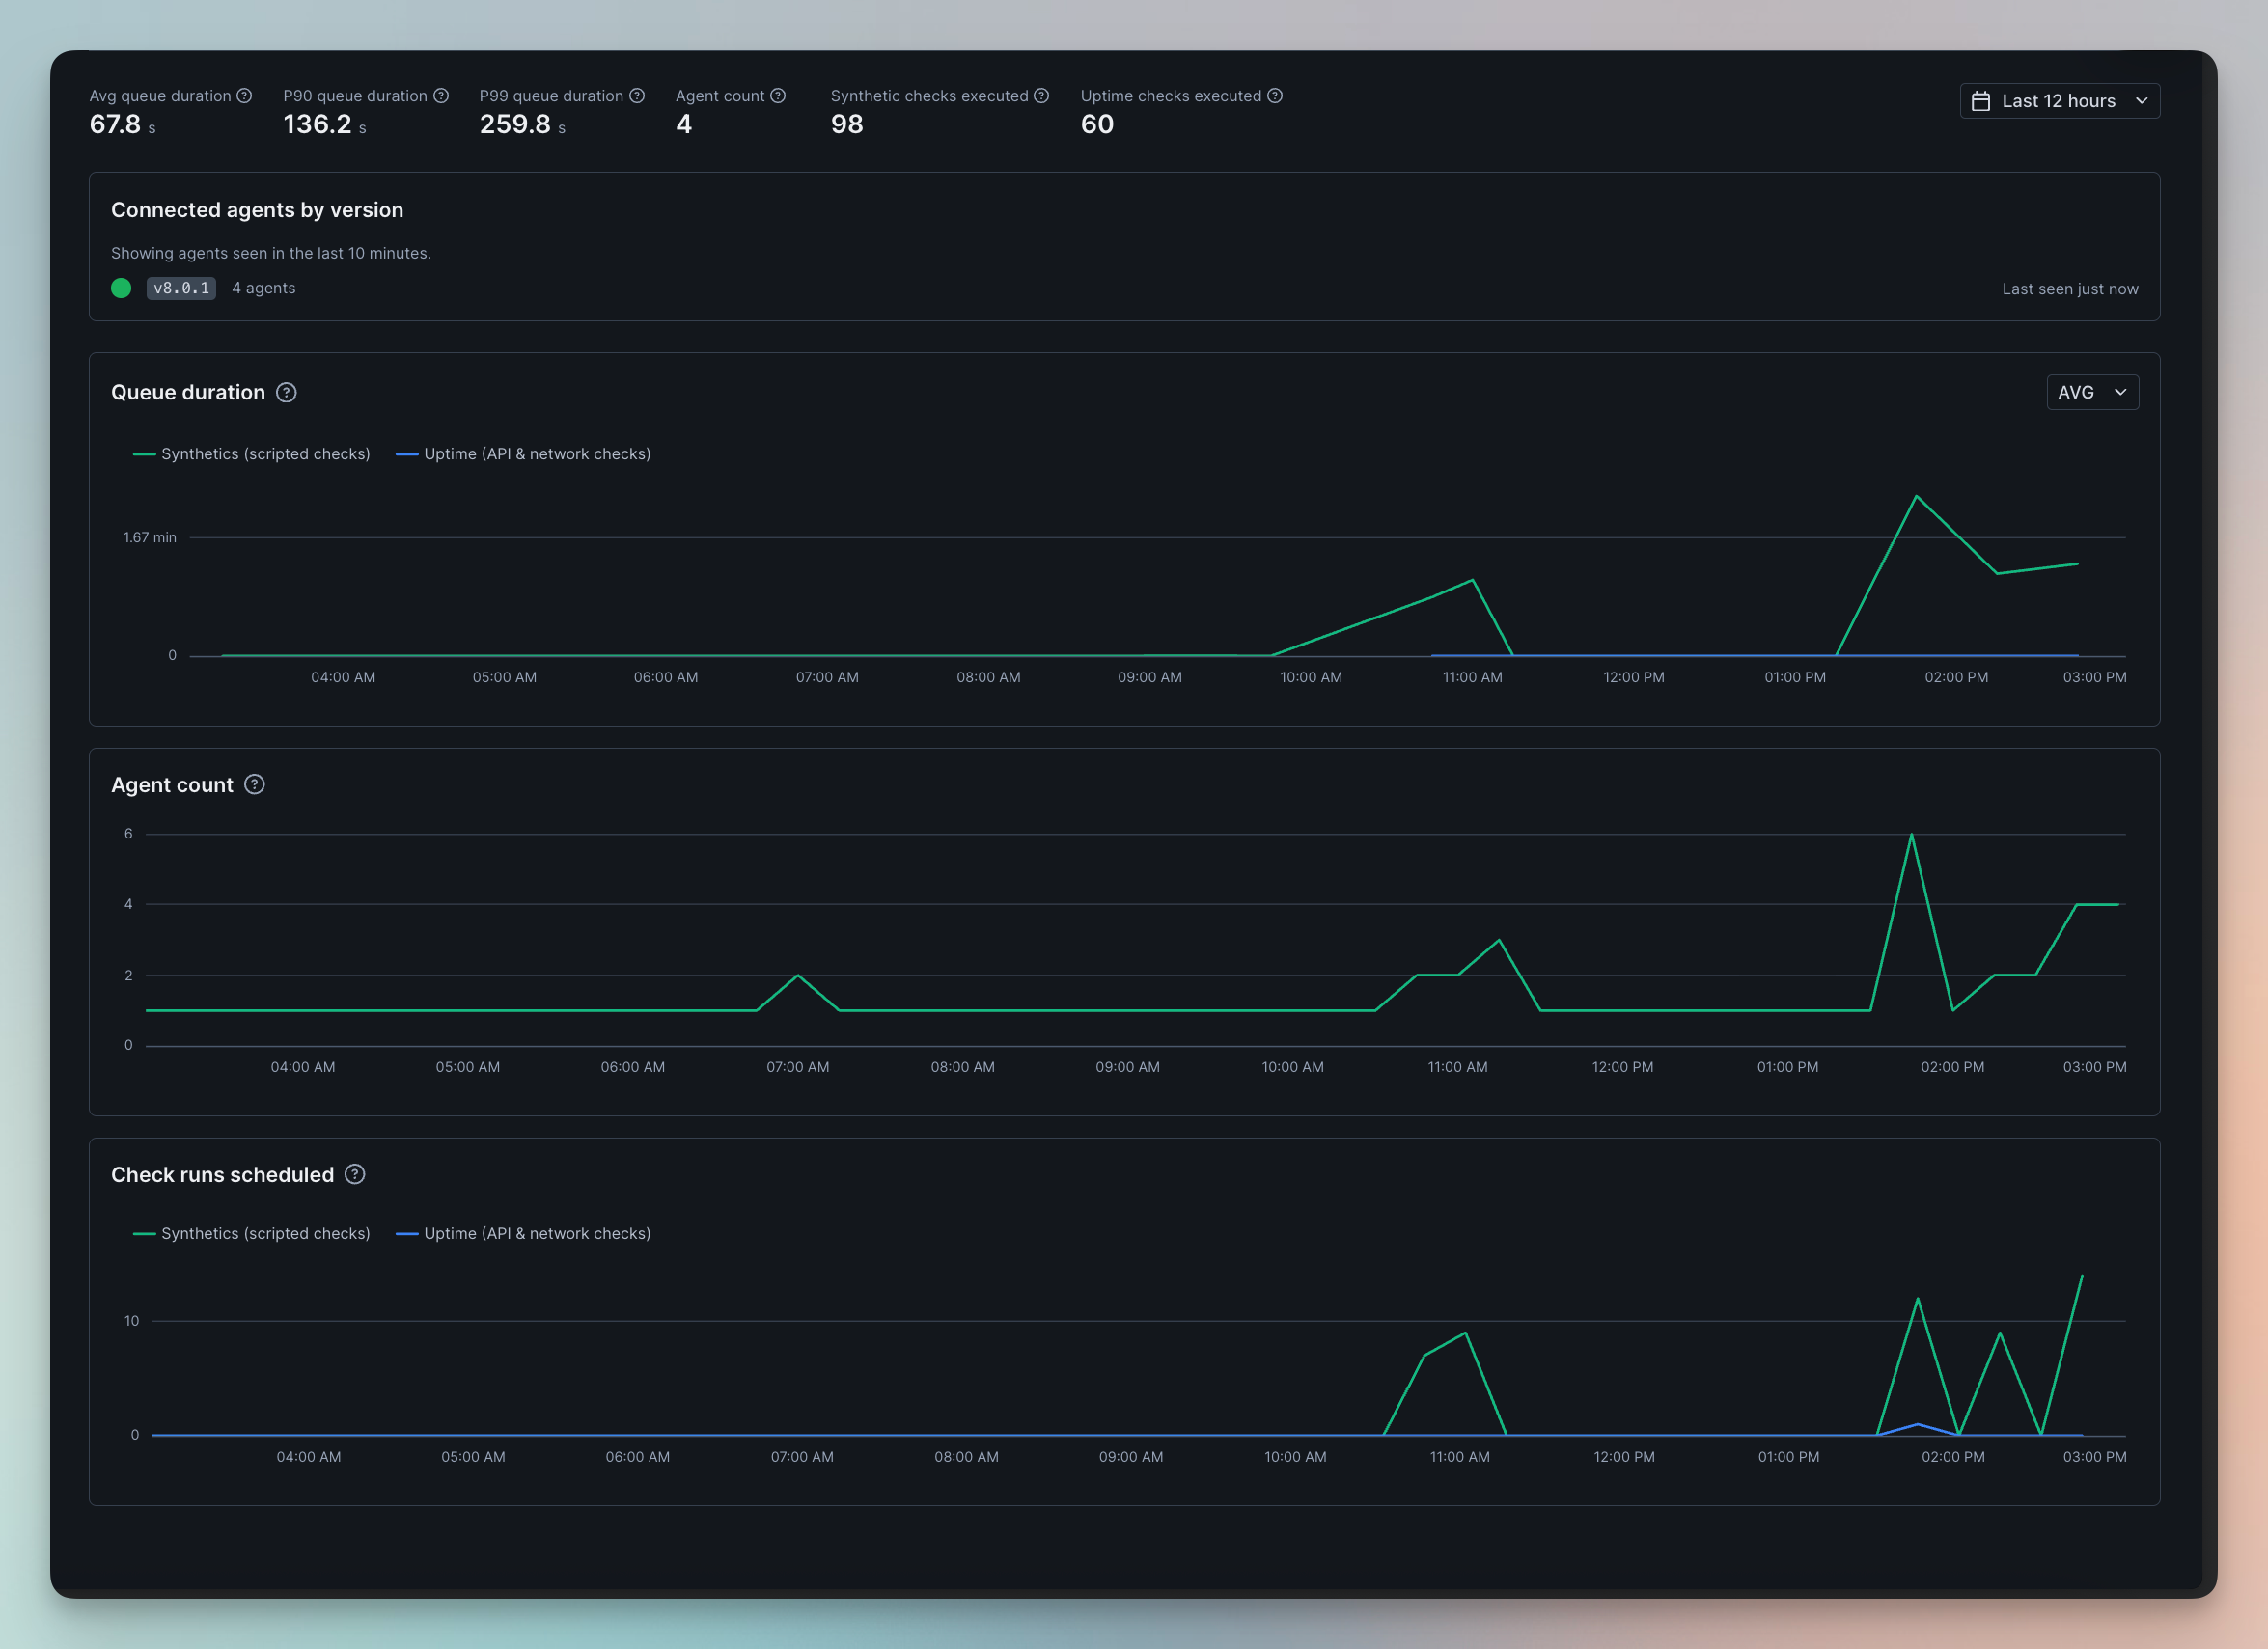
The new metrics include:
Queue duration — how long checks wait before an agent picks them up
Agent count — how many agents are currently reporting
Scheduled check runs — how many check runs are scheduled for the Private Location
These metrics help you spot whether your Private Location agents are over- or underprovisioned. For example, if checks are spending too much time in the queue before they run, that’s a strong signal that your agents may need more capacity. No more guessing whether the queue is fine, spicy, or quietly on fire.
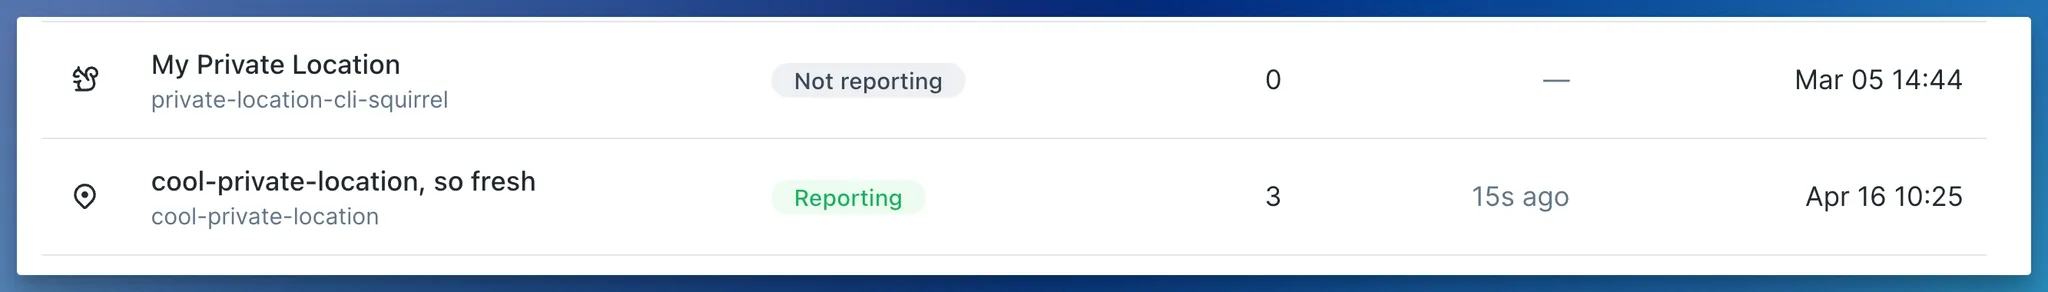
We also updated how Private Location status is shown in the UI. The previous green-dot indicator has been replaced with a clearer Reporting / Not Reporting state, with Last seen at shown alongside it. This makes agent health checks easier to read at a glance.
For teams running Private Location agents on Kubernetes, these metrics are also available through Prometheus V2. You can use them to autoscale Private Location capacity with KEDA, based on queued and in-flight check runs
The new Private Location Autoscaling Guide shows how to use the checkly_private_location_check_runs metric to scale agent pods up during traffic bursts and back down when demand drops. That helps prevent queue buildup without keeping idle capacity around just in case.
Alert channels now support environment secrets
Alert channels now support secrets with the double {{ secret here}} syntax, so sensitive values like API keys no longer need to live in plain text inside alert channel configs.
That means fewer secrets sitting around in the UI or API responses. Always a good day when plaintext secrets pack their little bags and leave.
You can also convert existing values into secrets by clicking the new lock icon in the alert channel configuration.
Maintenance Windows: pause checks, silence alerts, or both
Maintenance windows now give more granular control over what happens to checks during planned downtime. Instead of just pausing checks, two behaviors can be independently configured: Pause check execution
Scheduled check runs are skipped for the duration of the window
Scoped to all checks or specific checks by tag
Manual and triggered runs (UI, API trigger) always execute regardless [new behavior]
Silence alerts
Checks keep running and collecting data, but alert notifications (email, Slack, etc.) are suppressed
Scoped to all checks or specific checks by tag, can use different tags than the pause scope
New reminders are suppressed, existing reminders are paused and resume after the window ends
The home dashboard now shows a maintenance badge on affected check, group, and heartbeat rows with paused/silenced state, an updated banner summarizing active behaviors, and a new "Under maintenance" status filter.On the API side, maintenance window endpoints now accept pauseAllChecks, silenceAlertsTags, and silenceAllAlerts, in addition to the pre-existing tags.Existing maintenance windows continue to work as before. CLI, TF and Pulumi support isn't included and will require a follow-up.
API PSA: swagger.json is deprecated
The old API spec at:
<https://api.checklyhq.com/swagger.json> is now deprecated and frozen.
Please use the newer OpenAPI spec instead:
<https://api.checklyhq.com/openapi.json> The old swagger.json file will remain available for compatibility, but now includes a deprecation notice in the file description and response headers. Modern spec, fewer sharp edges.
Happy monitoring!
Questions or feedback?
May 29th, 2026
New
We shipped a focused batch of Playwright Check Suite improvements to make runs faster, more reliable, customizable and easier to debug.
You can now cancel runs, use custom Node / Bun versions, rely on automatic retries for transient dependency failures, cache Playwright browsers in Private Locations and use globalTimeout from Playwright and see trace-processing details.
Playwright Check Suite runs are now cancellable.
Started a Playwright Check Suite run and already know it needs to stop?
You can now cancel queued or in-progress runs from the UI or CLI. This works for runs started from Schedule now and for runs triggered through test sessions, including:
npx checkly testnpx checkly pw-testnpx checkly trigger
You can cancel a run in two ways:
Click Cancel Run from the Playwright Check Suite Runs or Test Session Run pages
Press
CTRL+Con Checkly CLI 8.0.0 and later
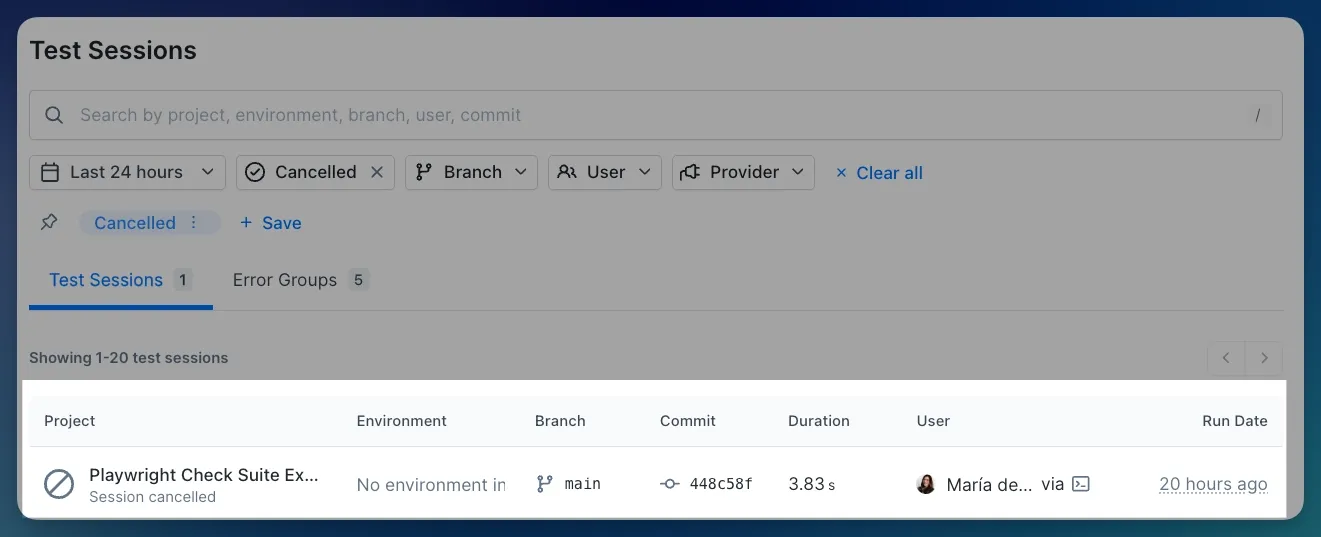
Cancelled runs now show a Cancelled status in your run history so you can distinguish them from failures.
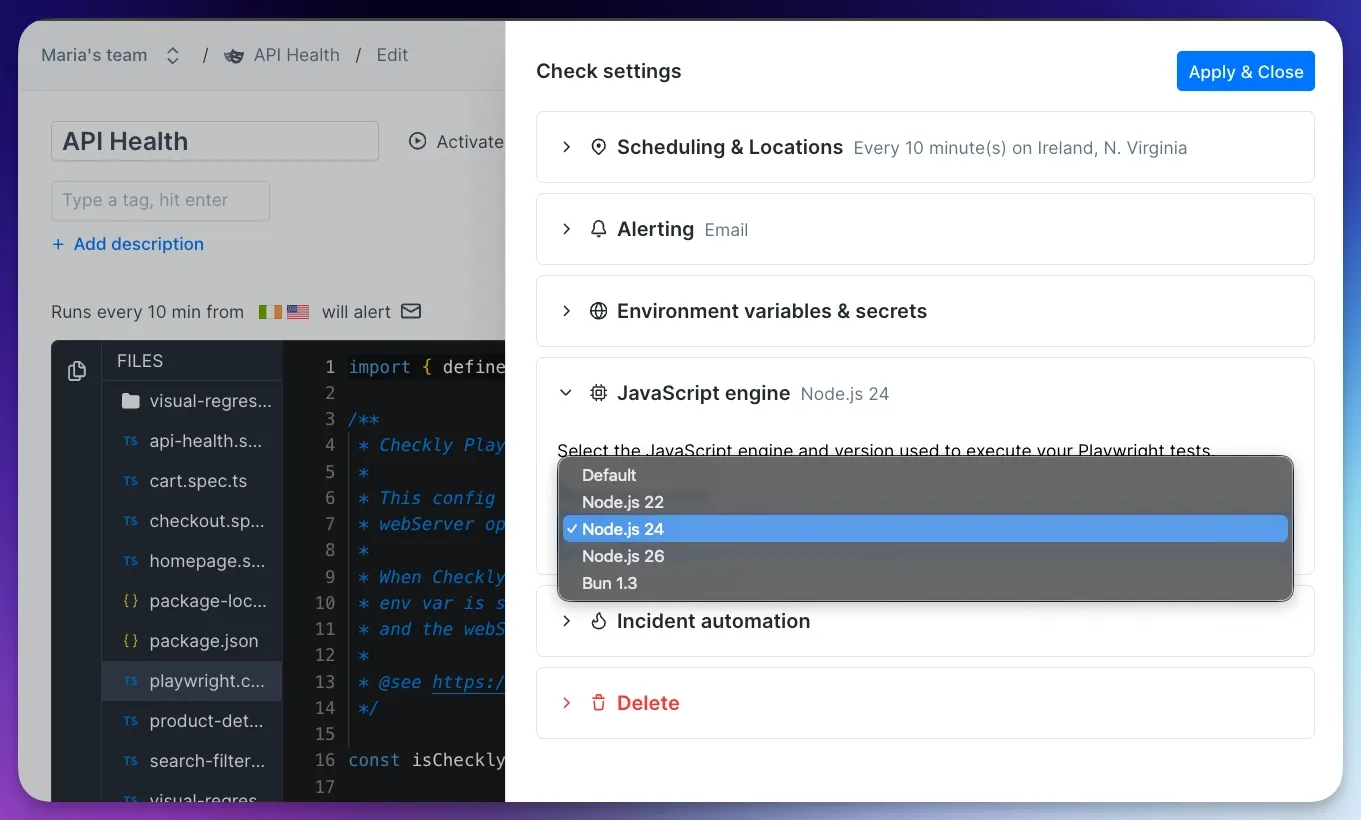
Choose your Node/Bun runtime engine
Playwright Check Suites now support multiple Node.js and Bun engines, configurable from the UI and
in code.
Starting with Checkly CLI 8.1.0, the CLI looks at your project’s version files and selects a compatible runtime automatically, including:
.nvmrc.node-version.bun-version
Supported runtimes:
Node.js
22defaultNode.js
24Node.js
26Bun
1.3default
If your project specifies a different version, Checkly picks the closest compatible runtime for you.
You can also override automatic detection by setting the engine property:
import { Engine, PlaywrightCheck } from 'checkly/constructs' new PlaywrightCheck('my-playwright-check', { /* ... */ engine: Engine.node('24'), }) Available from Checkly CLI 8.1.0
Browser caching across runs in Private Locations
Playwright Browser caching has now landed in Private Locations: Playwright Check Suites now cache Playwright browsers across runs on the same Private Location agent. No more re-downloading browsers on every run: when a cached browser exists, the installation step is skipped entirely.
Faster startup times
No repeated browser downloads
Lower bandwidth usage on Private Location agents
Zero configuration required
Caching is scoped to each Private Location agent. Runs on different agents install browsers independently. Available since Private Location agent version 8.2.0.
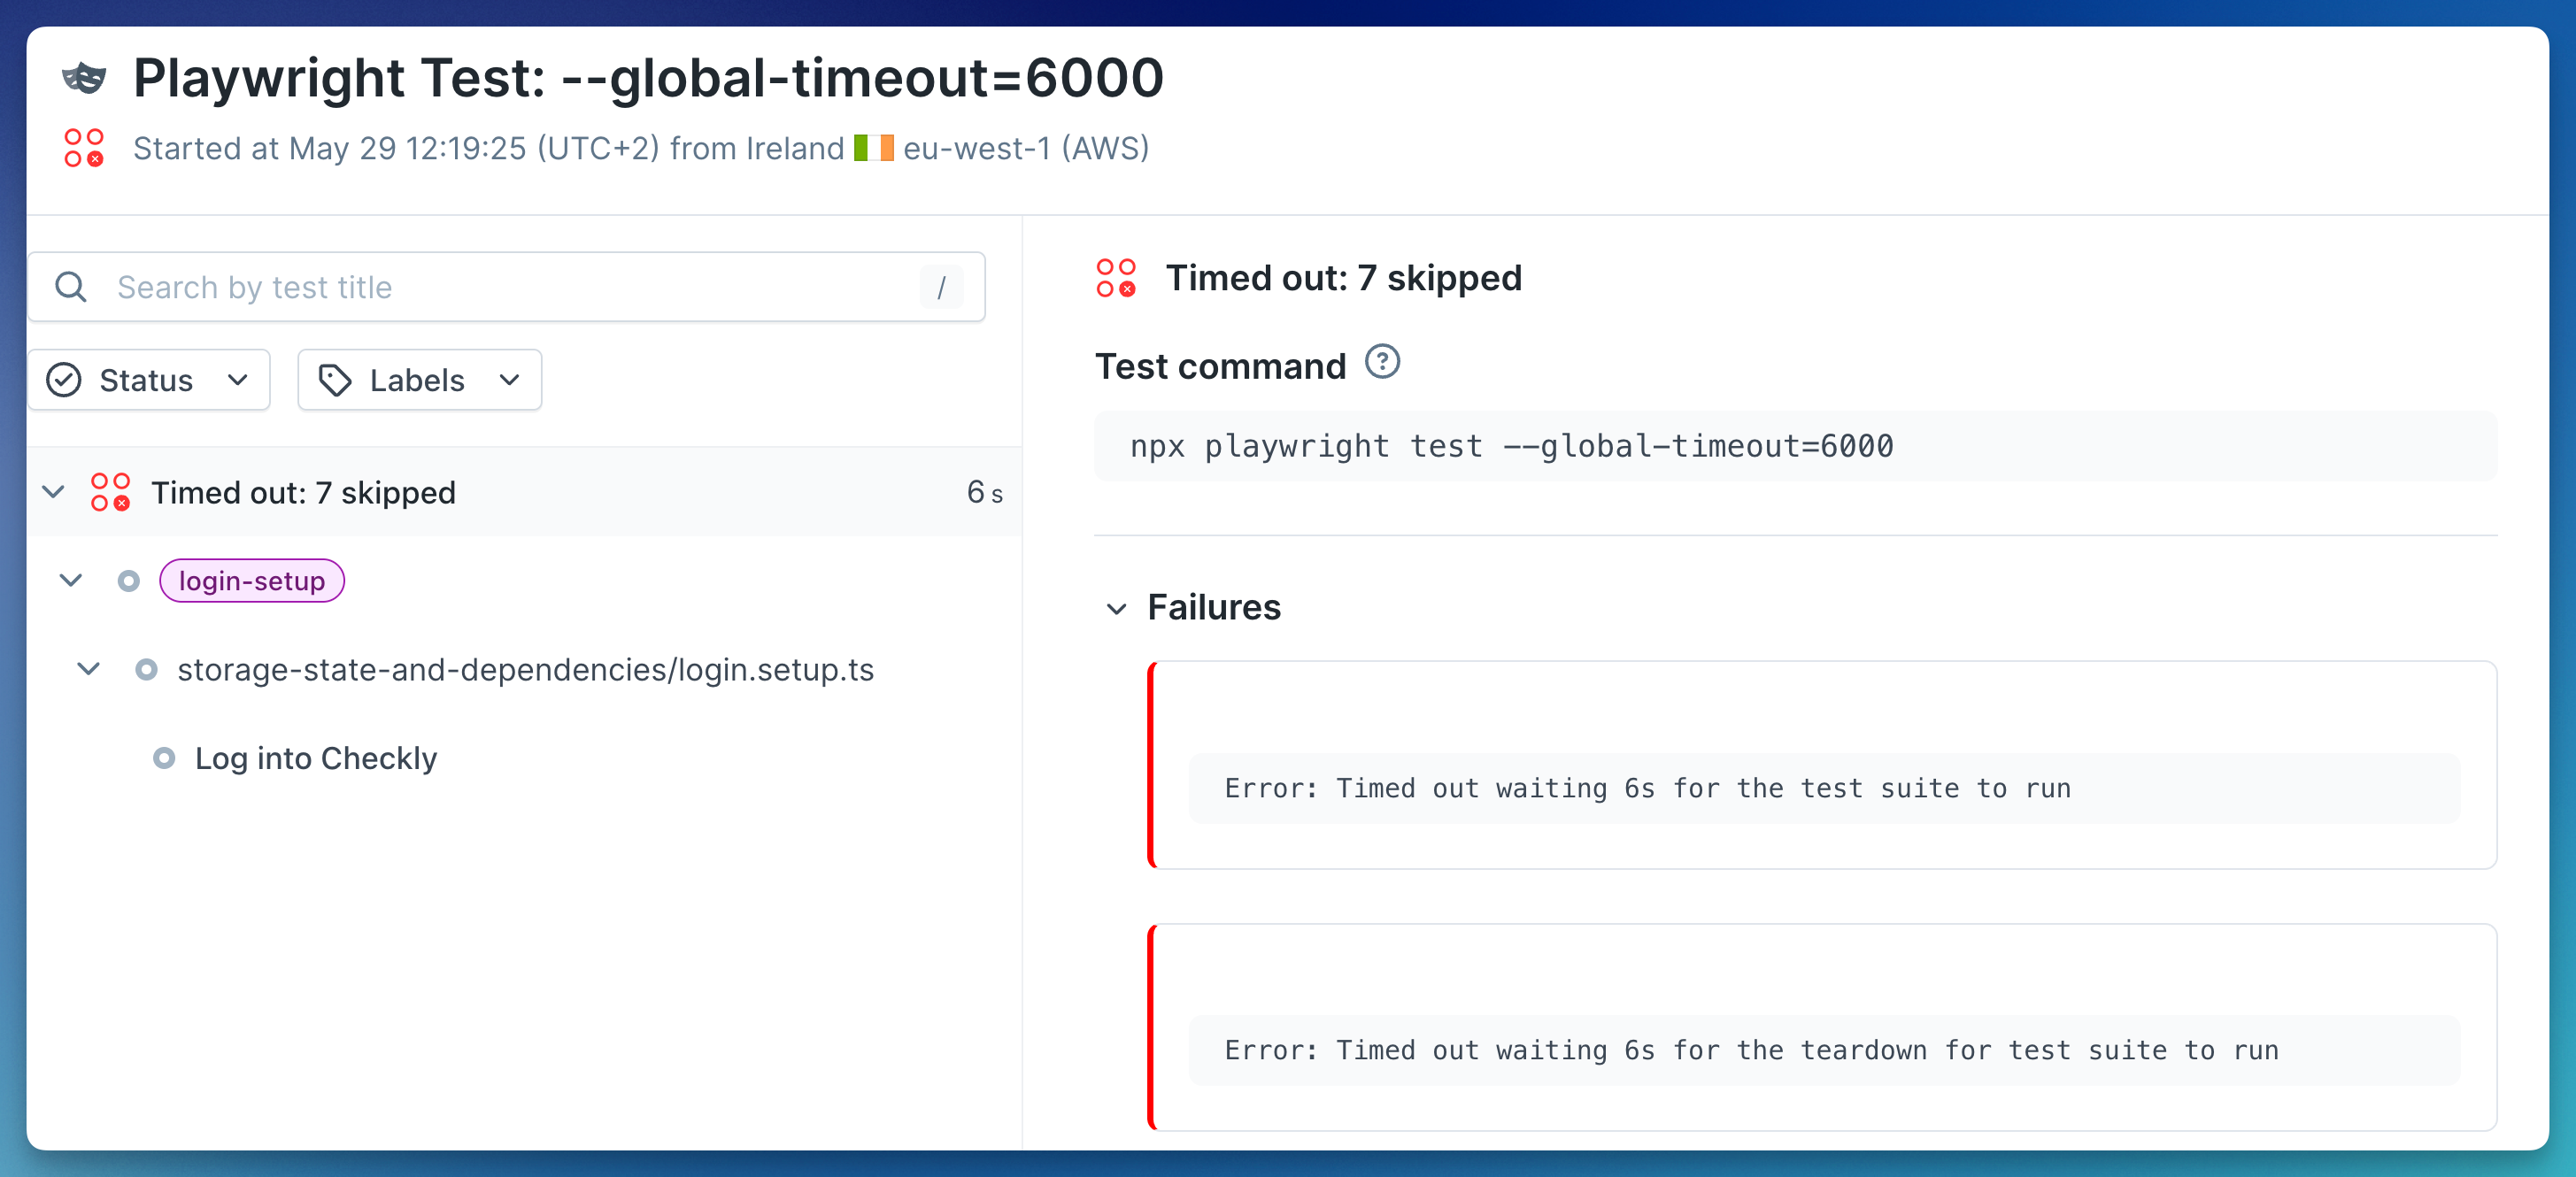
Playwright’s globalTimeout is now fully supported
Playwright's globalTimeout now behaves as you expect in Checkly.
Until now, global timeouts set in your Playwright configuration were respected at runtime but not visible in Check run results. That's fixed.
You can control the maximum duration of a Check Suite run using Playwright's native global timeout (in milliseconds). In your playwright.config.ts:
export default defineConfig({ globalTimeout: 120_000, // 2 minutes }); Or pass it as a flag in your testCommand:
testCommand: npx playwright test --global-timeout=120000
When a run exceeds the limit, Playwright skips all remaining tests and reports the check as failed. The timeout error appears in both the logs and the Failures tab, along with a troubleshooting guide to help you identify what to adjust.
A few things to keep in mind:
If you set a global timeout in both
playwright.config.tsand yourtestCommand, the flag takes precedence, matching Playwright’s own behaviour.globalTimeoutlimits the entire suite, not individual tests. For per-test limits, use Playwright'stimeoutoption.
Automatic retries for environment setup steps
Some setup steps fail for boring reasons: a temporary network issue, a cache hiccup, or the internet having a little wobble.
Check runs now automatically retry setup steps that are prone to transient failures, reducing false negatives without requiring any config changes.
Downloaded package managers are cached in the dependency cache after a successful Corepack run
If all dependency cache download attempts fail, the run falls back to a clean install
No configuration needed. Retries happen automatically.
More reliability, better logs
We’ve added a couple of behind-the-scenes upgrades that make Playwright Check Suites more reliable and easier to troubleshoot.
Dependencies cache has moved to a Least Recently Used cache, all current Playwright Check Suites and new ones will now use and automatically refresh the same cache key so that it doesn’t expire.
Trace processing details in logs. Check logs now surface post-processing details: report generation, trace processing, and trace sanitizing (secret scrubbing), each with its own timing. This gives you a clearer view of what happens after your tests finish, especially for suites with lots of traces.
Happy monitoring!
Questions or feedback? Join our Slack community.
May 27th, 2026
New
Checkly CLI
Checkly CLI 8 is here with three big behavior changes: the CLI is now ESM-only, CTRL+C now cancels running checks, and test, pw-test and trigger now record results by default.
It also adds support for multiple Node.js/Bun versions, simplifies TypeScript support, updates how Playwright include patterns resolve, and automatically loads .env files when present.
v8.0.0 ESM-only and updated Node.js requirements
The Checkly CLI is now distributed as ESM only instead of CommonJS.
CLI 8 requires Node.js versions matching ^20.19.0 || >=22.12.0
In plain English, you’ll need to use
Node.js
20.19.0or later on the Node 20 release lineNode.js
22.12.0or later
Earlier Node.js 20 and 22 versions are not supported. Before upgrading, make sure your local development, CI, and deployment environments use a compatible Node.js version.
Your own projects can of course still use CommonJS.
v8.1.0 Playwright Check Suites now support multiple Node/Bun versions
When using Playwright Check Suites, the CLI now looks at your project’s version files (.nvmrc, .node-version, .bun-version, etc.) and selects a compatible Node or Bun version for you. We currently support the following versions:
Node.js:
22(default),24,26Bun:
1.3(default)
If you use a different version, we’ll choose the most compatible version for you.
You can also override automatic detection by setting the new engine property:
import { Engine, PlaywrightCheck } from 'checkly/constructs'
new PlaywrightCheck('my-playwright-check', {
/* ... */
engine: Engine.node('24'),
})v8.0.0 No need to install a TypeScript loader separately anymore!
Starting with CLI 8, Checkly uses jiti exclusively. It supports modern TypeScript features out of the box, does not require a tsconfig, and now supports tsconfig paths automatically.
jiti is now bundled as a direct dependency when you install Checkly:
npm install checkly@latest So you no longer need to install or manage it separately. That means no extra loader setup and one fewer dependency to manage.
For type checking, please rely on your editor of choice, and make sure that your type checking workflows cover your Checkly files. jiti does not produce type errors.
ts-node is no longer supported.
v8.0.0 Test sessions are now recorded by default
The test and trigger commands now record results by default.
That means your runs will be recorded unless you explicitly opt out. To disable recording, use the --no-record option:
npx checkly test --no-record
npx checkly trigger --no-record
If your scripts relied on recording being off by default, update them before upgrading.
v8.0.0 CTRL+C now cancels running Playwright Check Suites
Ever started checkly test or checkly trigger and realized three seconds later it was absolutely not going to pass?
No need to watch it fail in slow motion.
Pressing CTRL+C during test , pw-test or trigger now cancels in-flight test sessions instead of leaving them running in the background eating into your quota.
npx checkly test
# CTRL+C
# Cancelling Playwright checks... ⊘ Docs Environment (0ms)
Need the previous “keep running in the cloud after I disconnect” behaviour? Run in detached mode with --detach or -d
npx checkly test --detach
# CTRL+C
# Checks will continue running in the cloud.
v8.0.0 .env files are now loaded automatically
The CLI now automatically loads a .env file when one is present.
You can use it for configuration such as:
API keys
Account IDs
Environment-specific variables
To disable automatic .env loading entirely, set:
CHECKLY_NO_DOTENV=1 ℹ️ These environment variables are only available locally to the CLI - they do not become Checkly environment variables.
v8.0.0 Playwright include patterns now resolve from the config directory
Playwright check Suites include patterns now resolve relative to the directory of your Playwright config file, not the project root.
This now matches Playwright’s own behavior, which should make path resolution more predictable.
If your Playwright config lives in a subdirectory, double-check your include globs after upgrading.
Extra!
checkly rca run now support --test-session-error-group or -te to trigger a Root Cause Analysis on Test Session Error Groups.
Happy monitoring (and testing!)
Questions or feedback? Join our Slack community.
May 18th, 2026
Deprecation
We are deprecating the legacy Swagger 2.0 specification at:
https://api.checklyhq.com/swagger.json
This file will remain available, but it will no longer receive updates. To generate API clients, inspect the latest API contract, or keep tooling in sync with the Checkly Public API, use the OpenAPI specification instead:
https://api.checklyhq.com/openapi.json
If your tooling currently points to swagger.json, update it to use openapi.json.
Why OpenAPI?
We are investing further into improving our OpenAPI specification to enable better API client generation, and discoverability by AI agents. Maintaining two flavors of our API spec was risking drifts: keeping a single source of truth will guarantee you (and your agents!) have the latest endpoint definitions in hand.
Happy monitoring!
May 5th, 2026
New
Failing assertions for the API, URL, DNS, ICMP and TCP checks / monitors are now error grouped individually.
Previously, when one of the above checks or monitors failed due to one or more of its assertions failing, Checkly would create an error group named 1 of 3 assertions failed .
This was not ideal, as the one failing assertion of the three might not be the same always, but Checkly would still lump them into the same error group. This also would not trigger a new Rocky AI Root Cause Analysis (RCA) because the error group would not be new.
From today on, every failing assertion has its own dedicated error message bubbled up to the error group, triggering RCA’s when the actual assertion surfaces a new error situation.
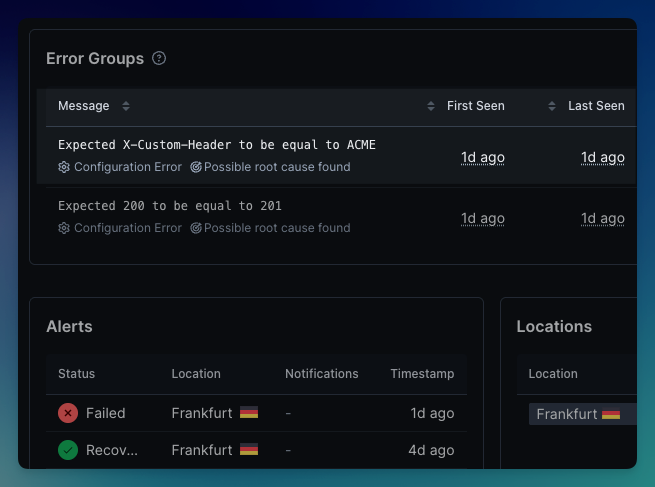
The above screenshot illustrates the new grouping: A specific assertion on an HTTP header failed and is recorded as its own error group.
This is now live for all Checkly users on all plans.
Happy monitoring!
Questions or feedback? Join our Slack community.
April 29th, 2026
Monthly update

Here’s a roundup of the new features and improvements we shipped over the past month.
Get started with the Checkly CLI using your agent
We’ve introduced a new command that helps you get started with Checkly from your terminal and integrates with your preferred agent:
# From ~/path/to/my-unmonitored-project/
npx checkly init
This sets up Checkly Skills, provides a prompt tailored to your project’s setup and one-shots your Checkly monitoring suite with Claude Code, Codex, Cursor… or any other agent of your choosing.
👉🏼 Learn more about the Checkly CLI and how to use it with your agent
Additional improvements:
checkly rca runandcheckly rca getto run and view your Rocky AI Root Cause Analysis directly from your CLI - Docs--preserve-resourcesfordestroyto detach resources from a CLI project while keeping them in your account - Docs
👉🏼 Learn more in the changelog update: Agent-friendly Checkly CLI
# Don't forget to upgrade!

npm i -D checkly@latest
pnpm i -D checkly@latest
yarn add -D checkly@latest
Introducing Runtime 2026-04
Runtime 2026-04 is now available for Browser and Multistep Checks. It includes upgraded Node.js and Playwright versions, along with updated built-in dependencies.
You can upgrade to this runtime from your account settings.
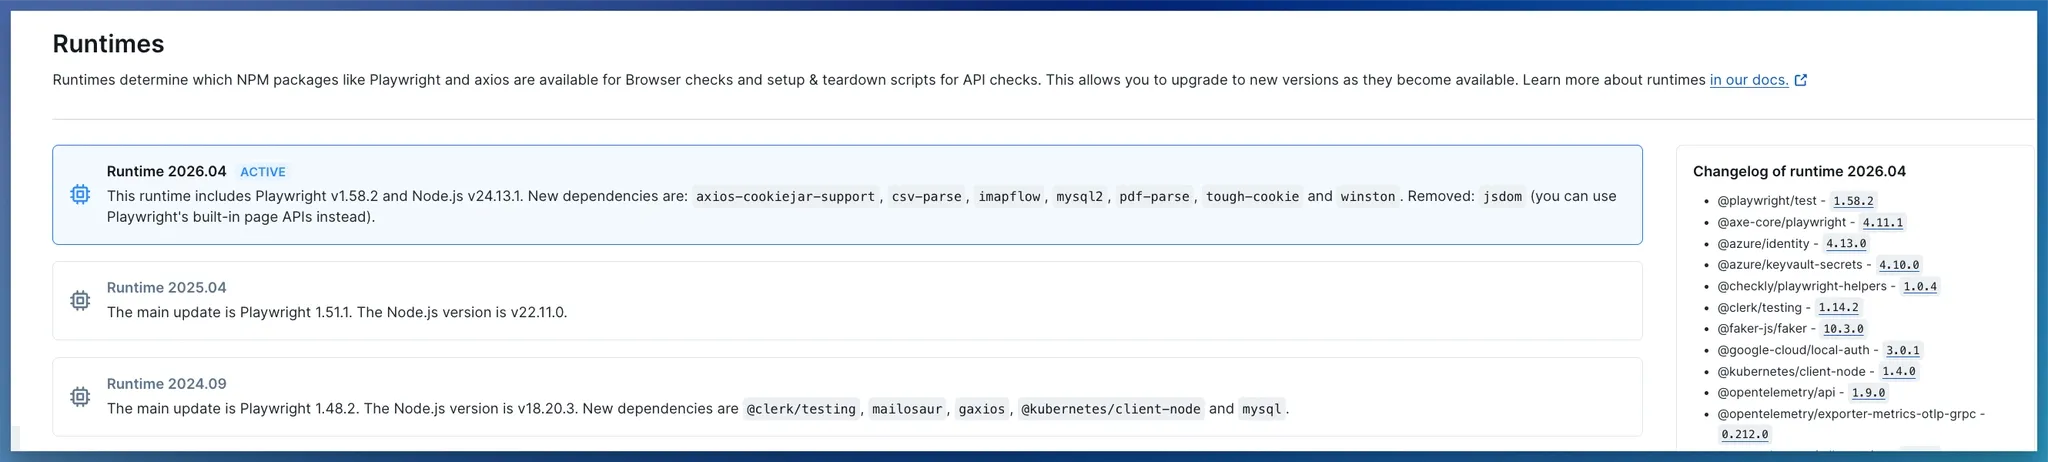
For private locations, support starts with image v7.0.0.
👉🏼 Lean more in the changelog update: Runtime 2026-04 is here
Playwright Check Suites
Bun support (CLI 7.11.0+)
Playwright Check Suites now support Bun as a package manager.
Improvements to custom dependency runtimes
Checkly uses your package.json and lockfile to install the dependencies your Playwright tests need to run in Playwright Check Suites.
Custom package manager versions: Define them in your
package.json, down to the patch version. Checkly caches resolved dependencies and reuses them on subsequent runsBetter install logs: All four package managers (npm, pnpm, yarn, and bun) now show detailed logs for both failed and successful dependency installs
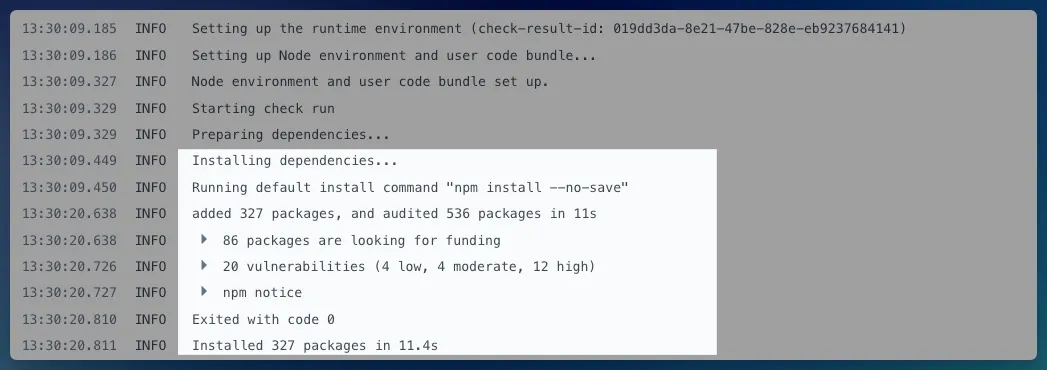
Cache uploads on successful runs only: After a check run passes, the dependencies cache is uploaded, creating a custom runtime for subsequent runs
Automatic cache invalidation: Caches are invalidated when your
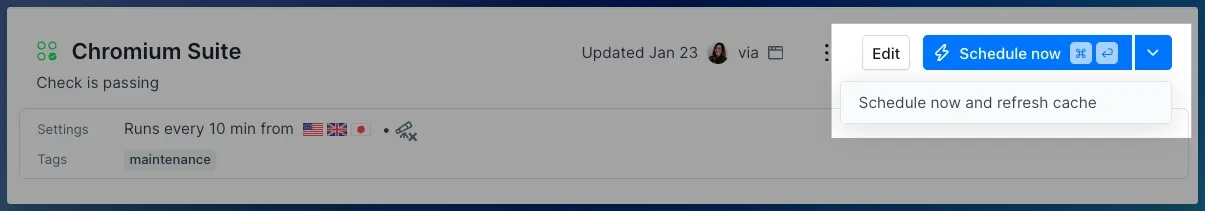
package.jsonor lockfile changes for Playwright Check Suites managed via CLI, Terraform, or PulumiManual cache refresh: The dependencies cache can be refreshed via the UI or CLI using
npx checkly test --record --refresh-cache
Checkly’s Playwright Reporter
Error groups across runs: Error groups now include suite runs from the Reporter, giving you AI-powered visibility across different
npx playwright testruns. Requires Checkly Reporter1.10+Fix: Large payload support: Running into size limits? Reach out - we’d like to understand your use case
Developer Experience
Support for uptime monitors on Private Locations: DNS and ICMP are now supported alongside other monitor types, starting with
v7.0.0Private Location uptime image: The new uptime image (
checkly/agent-uptime:X.Y.Z) is a lightweight option for running uptime monitors (URL, DNS, TCP, ICMP, Heartbeat) in Private Locations.Add context to checks with descriptions: Use check descriptions to add context to a monitor, such as runbooks or notes on team and service ownership. Supported by all applicable alert channels.
“Created by” filter in the UI: Filter checks by their creator on the reporting page. Includes account members and user API keys. Legacy API keys and service API keys are marked as “Unattributed”.
Single retries on Starter plans: Starter plans now include single retries for uptime monitors (URL, TCP, DNS, ICMP), helping catch intermittent failures.
Happy monitoring!
Questions or feedback? Join our Slack community.
March 31st, 2026
New
We shipped a brand-new runtime with a major upgrade: Playwright v1.58.2 and Node.js v24.13.1 are now available in Browser and Multistep Checks.
Head to Account settings > Runtimes to select it or make it your default. For the full spec, check the runtime documentation.
New dependencies
We added seven new packages to the runtime — some by popular request, some we think you’ll love:
axios-cookiejar-support— Persistent cookie handling for Axios requestscsv-parse— Parse CSV data directly in your checksimapflow— Monitor email delivery by reading IMAP inboxesmysql2— A faster, more modern MySQL clientpdf-parse— Extract and verify text content from PDFstough-cookie— Advanced cookie management across requestswinston— Structured logging for better debugging
Goodbye, jsdom
We removed jsdom from this runtime. For DOM interactions, use Playwright's built-in Page APIs instead.
Private locations
Runtime 2026.04 is available on Checkly Agent 7.0.0, which ships with the latest VM2 version for tighter security: 3.10.5. Update your agent to 7.0.0 or later to unlock this runtime in your private locations.
A note on performance
The updated VM2 security layer adds stricter sandboxing. Browser checks may run slower compared to previous runtime versions. We're working to improve this in upcoming releases.
All included dependencies
Every package available in Runtime 2026.04, all 67 of them:
@playwright/test1.58.2@axe-core/playwright4.11.1@azure/identity4.13.0@azure/keyvault-secrets4.10.0@checkly/playwright-helpers1.0.4@clerk/testing1.14.2@faker-js/faker10.3.0@google-cloud/local-auth3.0.1@kubernetes/client-node1.4.0@opentelemetry/api1.9.0@opentelemetry/exporter-metrics-otlp-grpc0.212.0@opentelemetry/sdk-metrics2.5.1@opentelemetry/sdk-trace-base2.5.1@t3-oss/env-nextjs0.7.3@xmldom/xmldom0.9.8aws41.13.2axios1.13.5axios-cookiejar-support5.0.5crypto-js4.2.0csv-parse6.1.0date-fns4.1.0date-fns-tz3.2.0dotenv17.3.1ethers6.16.0expect30.2.0form-data4.0.5gaxios7.1.3gmail-api-parse-message-ts2.2.33google-auth-library10.6.1googleapis171.4.0graphql16.13.0graphql-tag2.12.6imapflow1.2.10jose6.1.3jsonwebtoken9.0.3lodash4.17.23long5.3.2mailosaur11.0.2moment2.30.1mysql2.18.1mysql23.18.2nice-grpc2.1.14nice-grpc-client-middleware-deadline2.0.17nice-grpc-client-middleware-devtools1.0.9nice-grpc-client-middleware-retry3.1.13nice-grpc-common2.0.2nice-grpc-error-details0.2.12nice-grpc-opentelemetry0.1.20nice-grpc-prometheus0.2.9nice-grpc-server-health2.0.17nice-grpc-server-middleware-terminator2.0.16nice-grpc-server-reflection3.0.3nice-grpc-web3.3.9node-pop30.11.0otpauth9.5.0pdf-parse1.1.1pdf2json4.0.2playwright1.58.2prisma7.4.1protobufjs8.0.0tedious19.2.1tough-cookie6.0.0twilio5.12.2uuid11.1.0winston3.19.0ws8.19.0xml-crypto6.1.2xml-encryption3.1.0zod3.24.3
Happy monitoring!
Questions or feedback? Join our Slack community.