Option to remove response times from public dashboard
Hi,
We are monitoring some functions which are not natively possible to check straight from checkly to the endpoint. For these monitors, we have a container running in the cloud, that we are polling from Checkly. The container API checks the actual endpoint using its native calls, and presents a JSON body back to Checkly. Then we use assertions to determine the state of the actual endpoint and present a public dashboard with the status of our services.
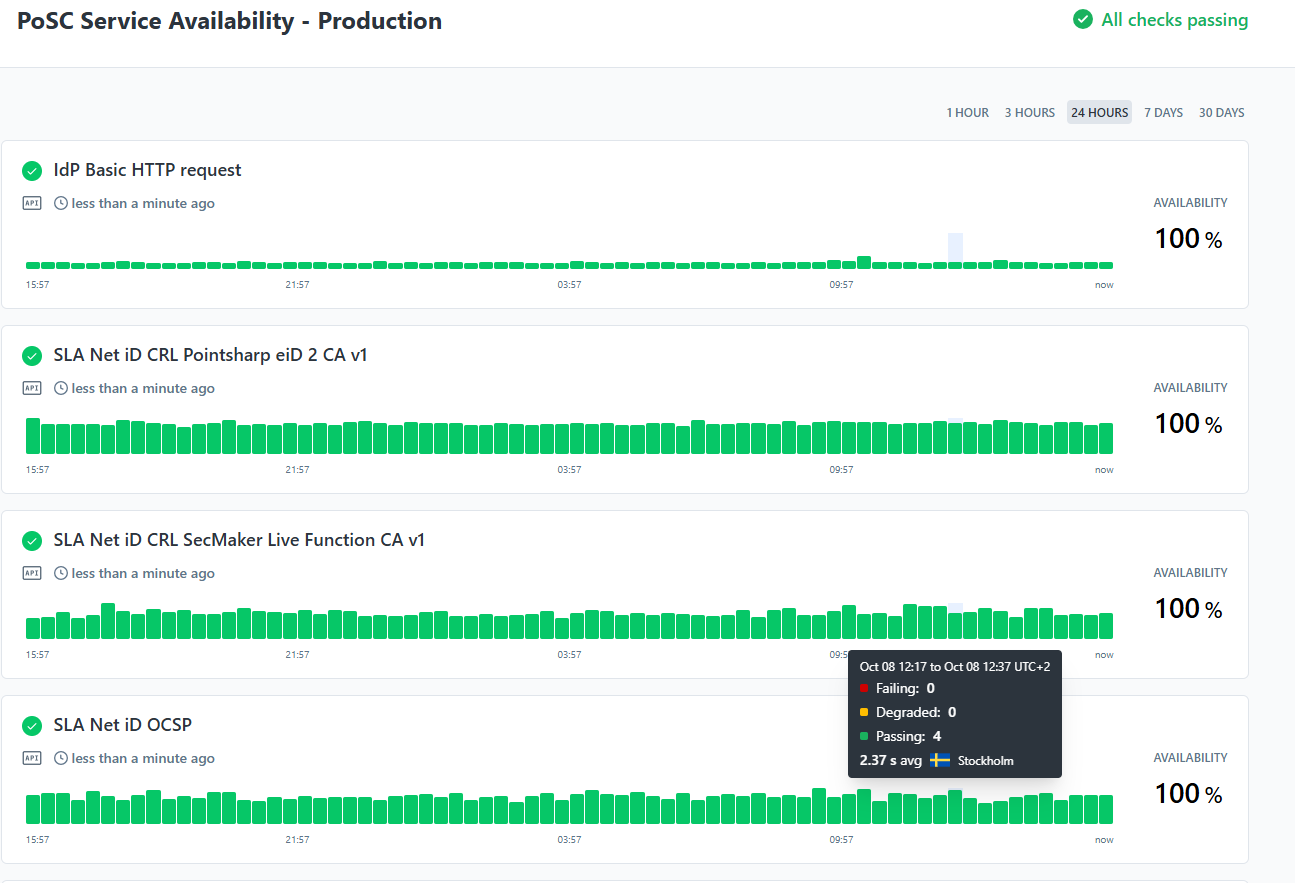
We have removed the response time averages on the right hand side, as those would be misleading. The actual endpoint is way faster than the response time noted by checkly when having to call an external monitoring API in some cloudy cloud. We would like the dashboard to only represent failing or passing checks, not care about the response time at all. Ie, make the green/yellow/red bars only represent the ratio of failed/degraded/passing check runs and not represent response times. Also, remove the response times from the floating widget that appears when hovering over the bars in the graph.
Log in to comment and vote
Linked to Simple Dashboard
No comments yet
Be the first to share your thoughts.