June 1st, 2026
Improved
Rocky AI RCA now pulls in OTeL traces and the last passing result
We just added two new sources of data Rocky AI can pull from to create a root cause analysis for your failing checks, monitors and test results.
Open Telemetry Traces
If you are using Checkly Traces, Rocky AI now automatically finds, queries and evaluates relevant traces linked to your failures. The example below is from Checkly’s own backend infrastructure.

Our API check that checks if our customer facing Prometheus endpoint works, failed with a 500 error.
The OTeL trace indicates this was actually do to our Clickhouse server returning a 500 errors, immediately telling our on-call team where to start looking.
Without the trace, we would have to look at all the various logging, error tracking and other tools that are integrated into the various middleware and infrastructure this request passes through (our load balancer, REST API server, Redis datastore etc.)
This feature is now live for all Checkly Traces users. Checkly Traces and Rocky AI Root Cause Analyses are part of the Checkly Resolve package. 10 Rocky AI root cause analyses are part of the free Checkly Hobby plan.
Last passing result
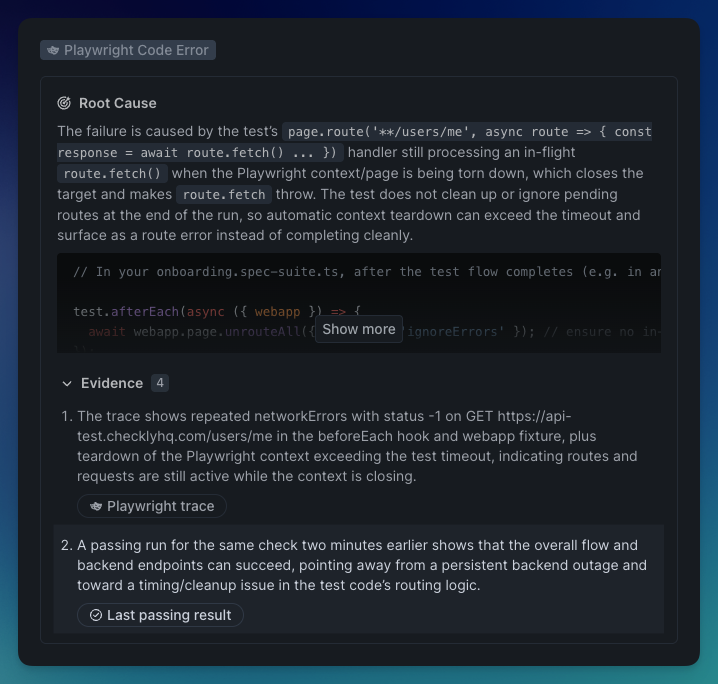
Rocky AI now automatically searches for and interprets a last passing result for your failing check, monitor or check result. This is useful to more clearly indicate what the nature of a regression is: specifically for more “verbose” checks like Playwright, Browser and Multistep checks.
It can indicate for instance that a network error is transient, not persistent, as it can see that an earlier call — 2 minutes earlier in the example below — passed without failure.
Two caveats:
A last passing result for monitors and checks might not always exist: the check might start failing immediately after creation.
A last passing result for test session might not exist because it is the first run, or when the test name was changed, the individual spec was removed from a test suite etc.
This feature is now live for all Rocky AI Root Cause Analyses users.
Happy monitoring!
Questions or feedback? Join our Slack community.