Failure alerts available from the analytics API endpoints
I’m trying to pull some reporting figures from the API for specific browser checks.
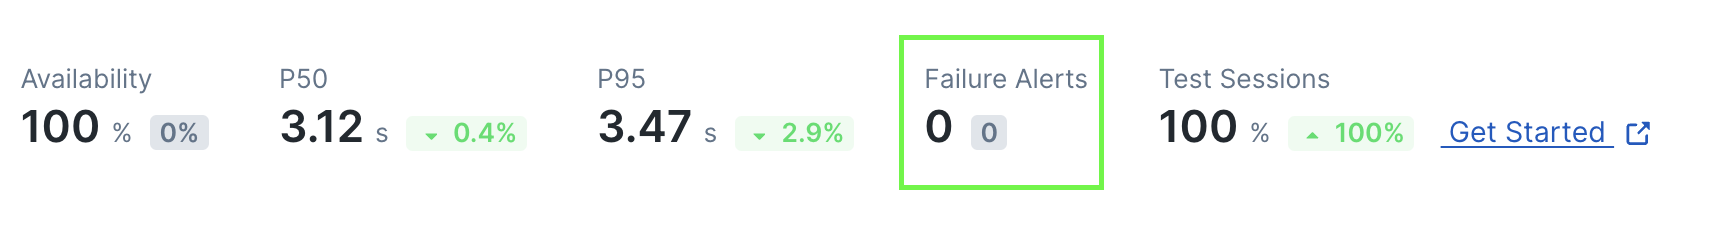
As an example I can get the availability figures from the analytics endpoint.
I’d also like to get the Failure Alerts that are shown on the check dashboard (in green box below)
I can get the alerts from the /check-alerts/{checkid} endpoint but it has a 6 hour window limit unlike the 30 day windows available on the dashboard.
Would it be possible to include failure alerts as a metric on the analytics endpoint at all?
Please authenticate to join the conversation.
In Review
💡 Feature Request
Almost 2 years ago

ryan.hird@bennetts.co.uk
Subscribe to post
Get notified by email when there are changes.
In Review
💡 Feature Request
Almost 2 years ago
ryan.hird@bennetts.co.uk
Subscribe to post
Get notified by email when there are changes.